.gif)

AI Agent Observability: What to Track for Every Interaction
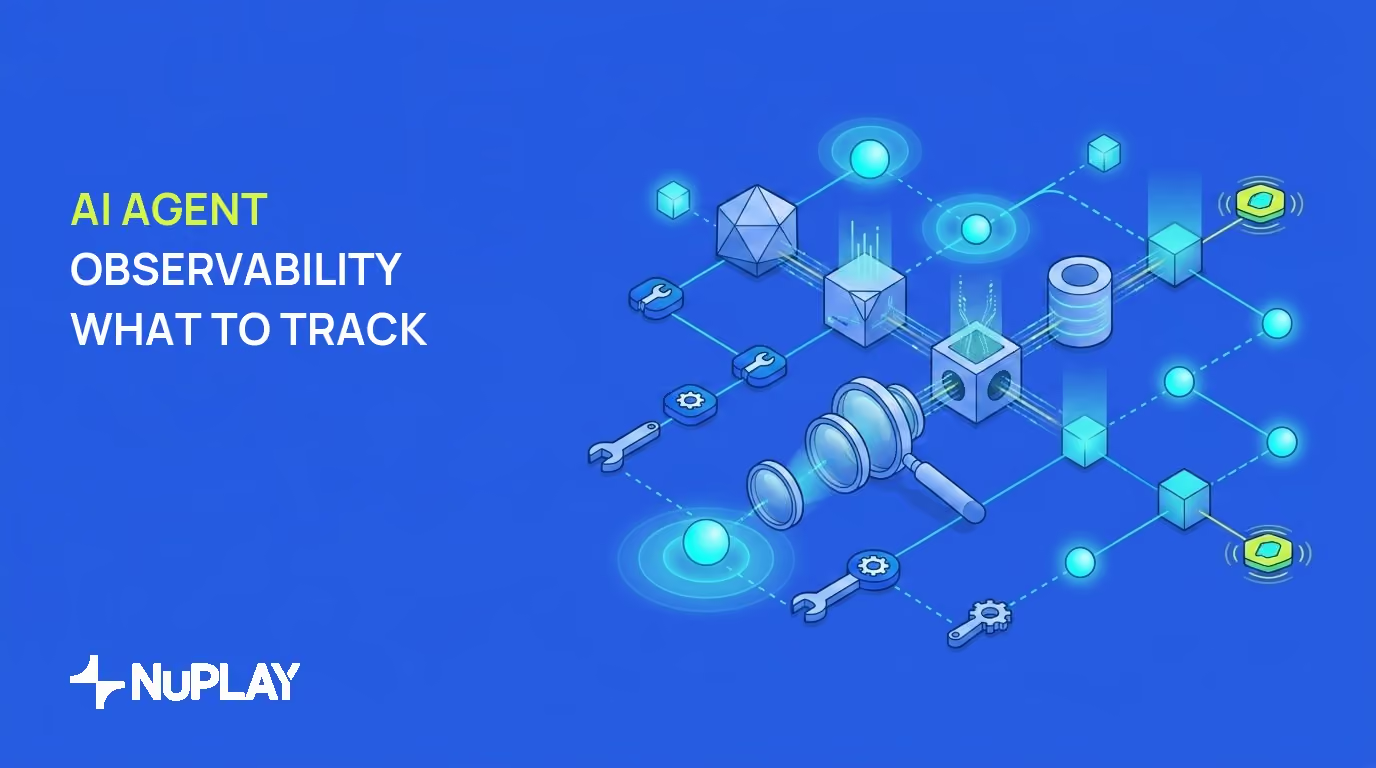
Agent observability is the practice of collecting telemetry and agent-specific signals on every workflow run so teams can see internal state and behavior. Capture large language model (LLM) calls, tool executions, retrieval steps, reasoning transitions, and state changes to diagnose failures, attribute cost, and apply governed fixes.
Enterprise teams now run agents on high-volume tasks in retail, insurance, financial services, collections, mortgage, and home services. These agents execute decisions that affect customers and compliance records. The shift from prototype to production exposes gaps in visibility that traditional application monitoring never addressed. Non-deterministic outputs mean the same input can take different paths, so logs that only show final status leave operators guessing.
This article gives a practical decision framework for the telemetry, traces, and evaluation loops required to keep agents reliable at scale, with clear instrumentation categories and a path from raw signals to governed change.
What is agent observability?
What does agent observability mean? Agent observability is the collection and analysis of metrics, events, logs, and traces (often called MELT data) plus agent-specific signals so you can understand internal state and behavior on every run. It applies to single agents, multi-agent systems, and deep agents that execute many sequential steps inside one workflow.
Traditional application observability focuses on infrastructure health and request paths. That is necessary but not enough. Agent observability must also record reasoning paths, tool calls, retrieval choices, and non-deterministic outputs that can change between identical inputs. Without those signals, you see that a task failed and still cannot say whether the failure sat in the model call, a tool argument, a stale document, or a bad handoff.
The scope spans three context tiers. Organizational context covers policies, product rules, and shared knowledge. Agent context covers memory, prior tool results, and intermediate plans. User context covers session state, identity attributes, and preferences that shape the decision. These tiers determine what data you retain, how long you keep it, and which spans matter when you reconstruct a decision path.
A workflow here means the tasks and decisions that achieve a business outcome. An agent is software that uses an LLM to produce an output or decision. Agentic work is the act of moving a task or decision into that agent mode. Observability has to follow the full path across those definitions, not only the final message returned to a customer.
Why agent observability matters in production
LangChain's State of Agent Engineering report (2026) found that 89 percent of organizations have implemented observability for their agents and 62 percent have detailed step-level tracing. Adoption is widespread, yet a large share still lacks the depth needed to localize failures inside multi-step runs.
Without step-level visibility, teams cannot isolate problems across tool calls, retrieval steps, or reasoning transitions. Cost attribution and latency diagnosis become guesswork. Regulated workflows in insurance, financial services, collections, and mortgage lose the evidence trail auditors expect when a decision is challenged. Operators then freeze change because they cannot prove what a fix would touch.
IBM's 2025 analysis of AI agent observability, citing a KPMG survey, found that 88 percent of organizations are exploring or piloting AI agent initiatives. The same IBM piece notes Gartner's prediction that more than one-third of enterprise software applications will include agentic AI by 2028. As volume grows, static deployments degrade when business rules, catalogs, or upstream systems change. Observability supplies the data needed to detect drift and trigger controlled updates rather than silent quality loss.
The business case is concrete. You need cost per successful task, p95 latency by span type, failure rates by tool, and a durable record of human handoff. Those measures support budget control, service-level agreements, and compliance evidence. They also support the shift from one-time launches that slowly decay to systems that improve through diagnosis, coverage, and governed change after each run.
NuPulse provides the status, volume, and outcome dashboard that surfaces these signals in one place. Teams use it to monitor production runs before any improvement cycle begins, so monitoring stays separate from the loop that proposes and ships fixes.
Core telemetry to capture for every interaction
Four categories of data must be instrumented for every task or decision, plus a fifth set of user and system events. Treat this list as a minimum checklist, not an optional backlog.
- LLM calls: model identifier, prompt version, input and output token counts, latency, and finish reason.
- Tool and API calls: arguments passed, results returned, success or failure status, retries, and duration.
- Retrieval steps: queries issued, documents or chunks returned, ranking scores, and any relevance signals recorded.
- Reasoning transitions and state changes: plan updates, chain-of-thought excerpts where policy allows, memory reads and writes, and context tier updates.
- User and system events: human handoff points, alert triggers, escalations, and explicit or implicit feedback signals.
IBM's 2025 AI agent observability guidance lists token usage, inference latency, response quality, model drift, API and LLM calls, failed tool calls, and human handoff among the primary metrics teams should watch. Capturing these at the point of execution allows later correlation across an entire workflow instead of after-the-fact log archaeology.
LangChain's agent observability resource stresses that production traces should capture LLM calls, tool calls, retrieval steps, reasoning transitions, and state changes. That mapping is the practical bridge from generic MELT data to agent-specific diagnosis. If any category is missing, root-cause work stalls at the first multi-step failure.
Instrument at the span boundary, not only at the workflow boundary. A single task may call an LLM three times, hit two tools, and retrieve documents twice. Aggregate metrics hide which step burned tokens or added seconds. Per-span fields also make cost attribution fair when several teams share models and tools.
Store prompt versions and tool schemas beside the run. When a regression appears weeks later, you need to know which configuration produced the trace. Pair that with outcome labels (completed, escalated, abandoned) so volume dashboards reflect business results, not only technical success codes.
Traces, spans, and multi-turn context
A trace represents one complete task from start to finish. Each span inside the trace records an individual step such as an LLM call, a retrieval query, or a tool execution. Parent and child relationships turn those spans into an execution tree you can walk when something goes wrong.
Multi-turn conversations and multi-agent handoffs require full trees so every transfer of control remains visible. If agent A hands work to agent B, the receiving span must carry the reason for the handoff, the payload summary, and the identity of both sides. Otherwise you only see a gap where context was lost. The same rule applies when control returns to a human: record who took over, what they changed, and whether the agent resumed.
Once daily runs exceed a few hundred, sampling and retention policies become necessary. Full traces for every interaction quickly exceed storage budgets and slow query paths. Define rules that keep high-value traces (failures, high cost, regulated journeys, low confidence) while discarding routine successes after a set period. Keep enough history to rebuild regression suites and to answer audit questions about a specific customer decision.
Retention should follow the three context tiers. Organizational policy spans often need longer retention than ephemeral user session noise. Agent memory writes that affected a decision should outlive raw token streams. Document these choices so engineering, risk, and operations share one definition of “enough history.”
Sampling too early is a common failure mode. If you drop 95 percent of traces before you understand baseline patterns, you starve evaluation sets and hide rare but costly paths. Start with higher retention on critical workflows, measure storage and query cost, then tighten. Prefer tail-based sampling that keeps errors and outliers over pure random sampling that treats every run as equal.
Structure IDs consistently: workflow ID, task ID, trace ID, span ID, and correlation IDs for upstream systems. Consistent identity is what lets a status, volume and outcome dashboard join telemetry to business outcomes without manual spreadsheet joins.
Evaluation: offline, online, and continuous loops
Offline evaluation runs curated test sets with known ground truth before any deployment. You score agents on fixed cases, compare against expected decisions or outputs, and block releases that regress. Online evaluation monitors live traffic, user feedback, and model drift after release. Neither mode is optional if you want production confidence.
The Hugging Face Agents Course unit on agent observability and evaluation frames offline work around test datasets with known answers and online work around live traffic and drift. It also highlights latency, costs, request errors, explicit and implicit user feedback, and accuracy-style quality checks as primary metrics to watch in those loops. Use that split to assign owners: pre-release quality gates versus production watchers.
LangChain's State of Agent Engineering report (2026) reports that 57 percent of respondents already have agents in production, while quality remains the top barrier at 32 percent. Those teams convert successful and failed traces into regression tests that catch future breaks. Production becomes the source of new cases, not only the place where old cases run.
Combine offline and online signals into a continuous loop. Report what happened on a run. Diagnose which span or context tier failed. Propose a fix aimed at the owning layer (prompt, tool wrapper, retrieval index, or orchestration). Try the fix against stored traces with rollback ready. Ship only after a human approves. That sequence turns observability data into governed improvement rather than ad-hoc patches.
NuLoop is built as a closed feedback loop that watches every agent run and moves work through Report, Diagnose, Propose, Try, Ship, with human approve-to-promote sign-off before any change lands. The same traces that power monitoring supply the evidence for each stage, so evaluation is not a separate science project disconnected from operations.
Keep evaluation scoped. A score on a synthetic chat set does not prove a collections workflow is safe. Map test cases to real task types, decision points, and failure modes you already see in traces. When online metrics move, promote the new examples into offline suites so the next release cannot repeat the miss.
Common pitfalls and how to avoid them
Teams often treat basic logs or print statements as sufficient observability. Those approaches collapse once volume or complexity increases because they lack structure for correlation across steps. Free-text logs rarely carry stable span IDs, token counts, or tool payloads you can query later. Replace ad-hoc printing with structured events at every LLM, tool, and retrieval boundary before traffic scales.
Another frequent error is focusing only on final output. A polished last message can hide three failed tool calls and a low-relevance retrieval. Without step-level spans, teams cannot determine whether a poor outcome came from retrieval, tool failure, reasoning, or stale organizational context. Review traces end to end on a fixed sample of failures each week until step-level habits stick.
Cost and latency attribution are frequently ignored until budgets or service-level agreements are breached. Instrument token usage, model identity, and per-span duration from the first production run. Tie those fields to workflow and customer segment so finance and engineering share one cost story. Waiting until a spike appears guarantees a fire drill without baseline data.
Sampling too aggressively early on removes the traces needed to build reliable evaluation sets. Start with higher retention on regulated or high-value journeys, then tighten once you know which paths are routine. Pair sampling rules with explicit keep lists for errors, human handoffs, and high-cost runs.
Finally, do not confuse a dashboard with an improvement process. Charts that only show volume and average latency will not tell you what to change. Connect traces to offline tests and to a governed change path so every serious incident produces a diagnosed fix, a trial against past runs, and a human decision to promote or reject. Observability without that loop leaves you well informed about decline you still cannot stop.
When quality is the barrier, as LangChain's 2026 field data shows for many production teams, the remedy is deeper instrumentation and tighter evaluation loops, not another unmonitored pilot.
Conclusion
Instrument LLM calls, tool executions, retrieval steps, reasoning transitions, and state changes for every interaction. Structure the data as traces and spans, apply sampling only after you have baselines, and feed production traces into offline and online evaluation. Close the loop with governed updates so workflows improve after every run through diagnosis, coverage, and controlled change rather than silent drift.
NuPlay runs enterprise workflows in production and improves them after every run through NuLoop, with agents, the systems they operate, and the context they draw on under one platform. If you want a walkthrough of how monitoring and the improvement loop fit your workflows, request a demo.




.jpeg)